Westchester, NY
Aesthetic
Medicine
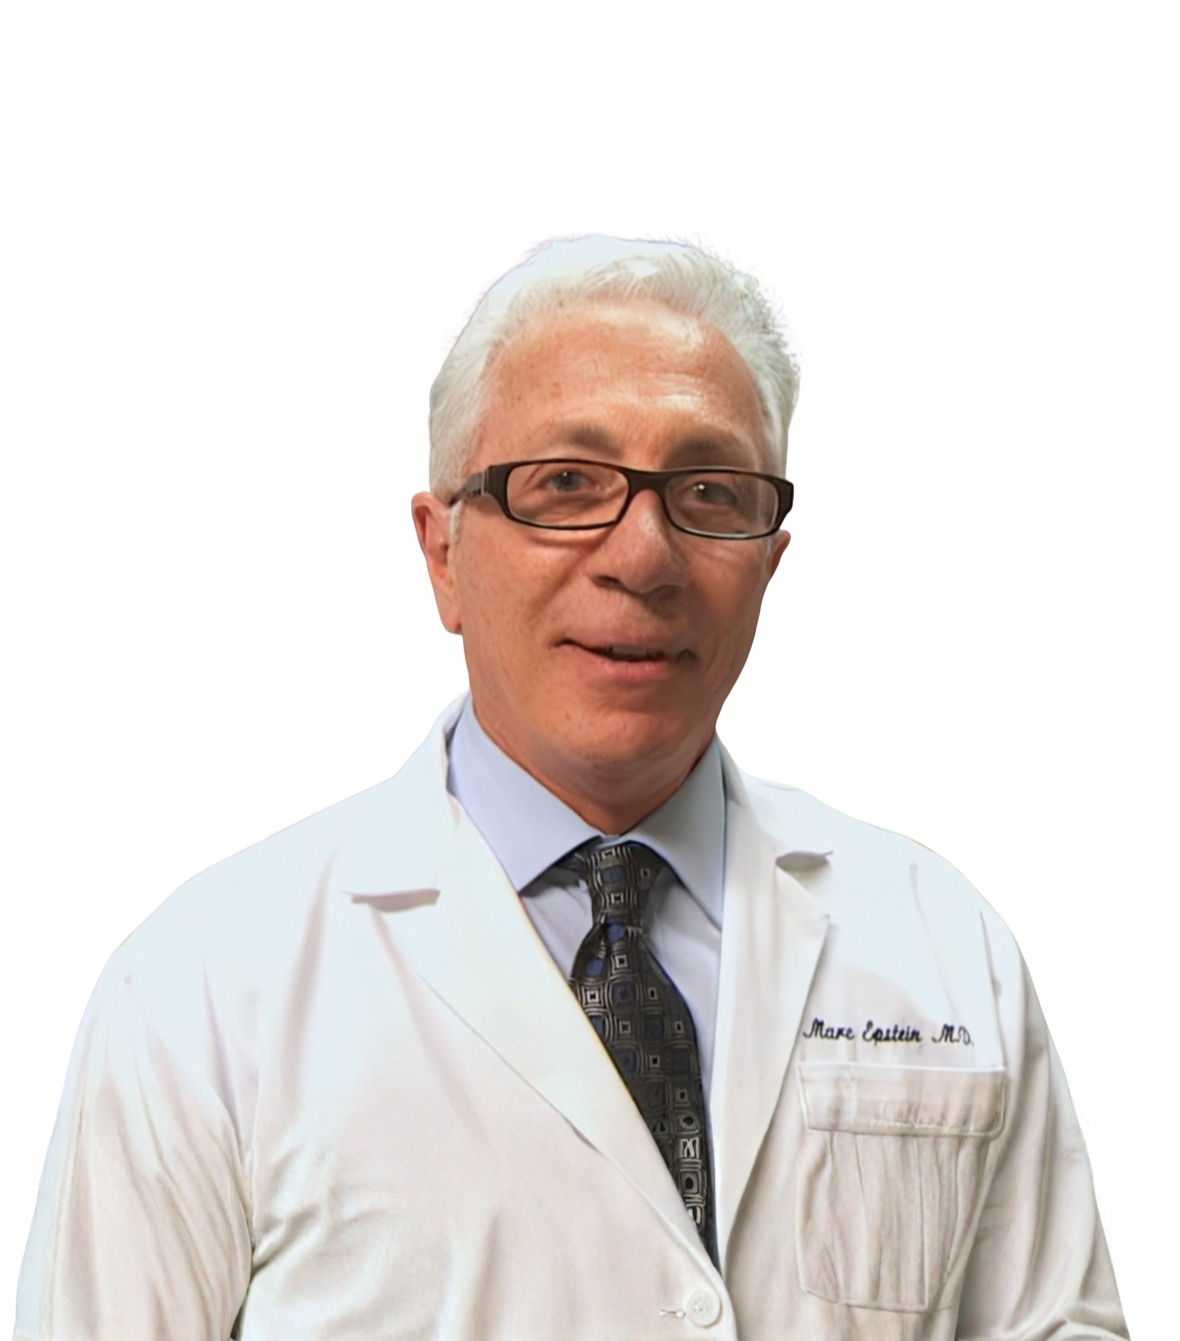
You deserve to look as vibrant as you feel. Dr. Marc L. Epstein brings over 30 years of medical expertise and an artistic eye to every treatment at his Westchester County practice.
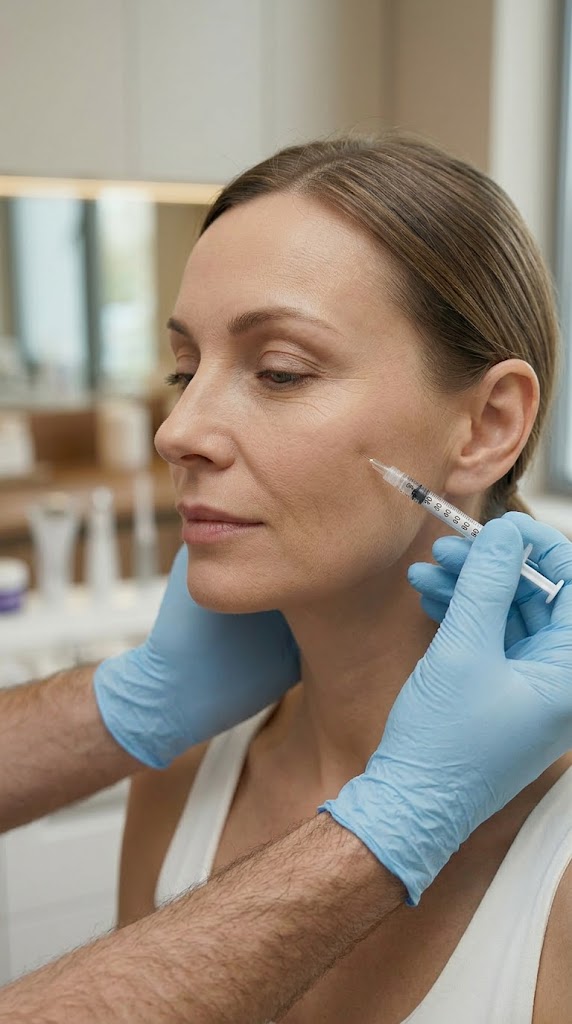
From Botox, Dysport and dermal fillers to non-surgical facelifts, every procedure is physician-performed. Dr. Epstein personally administers each injection — no nurses, no PAs.
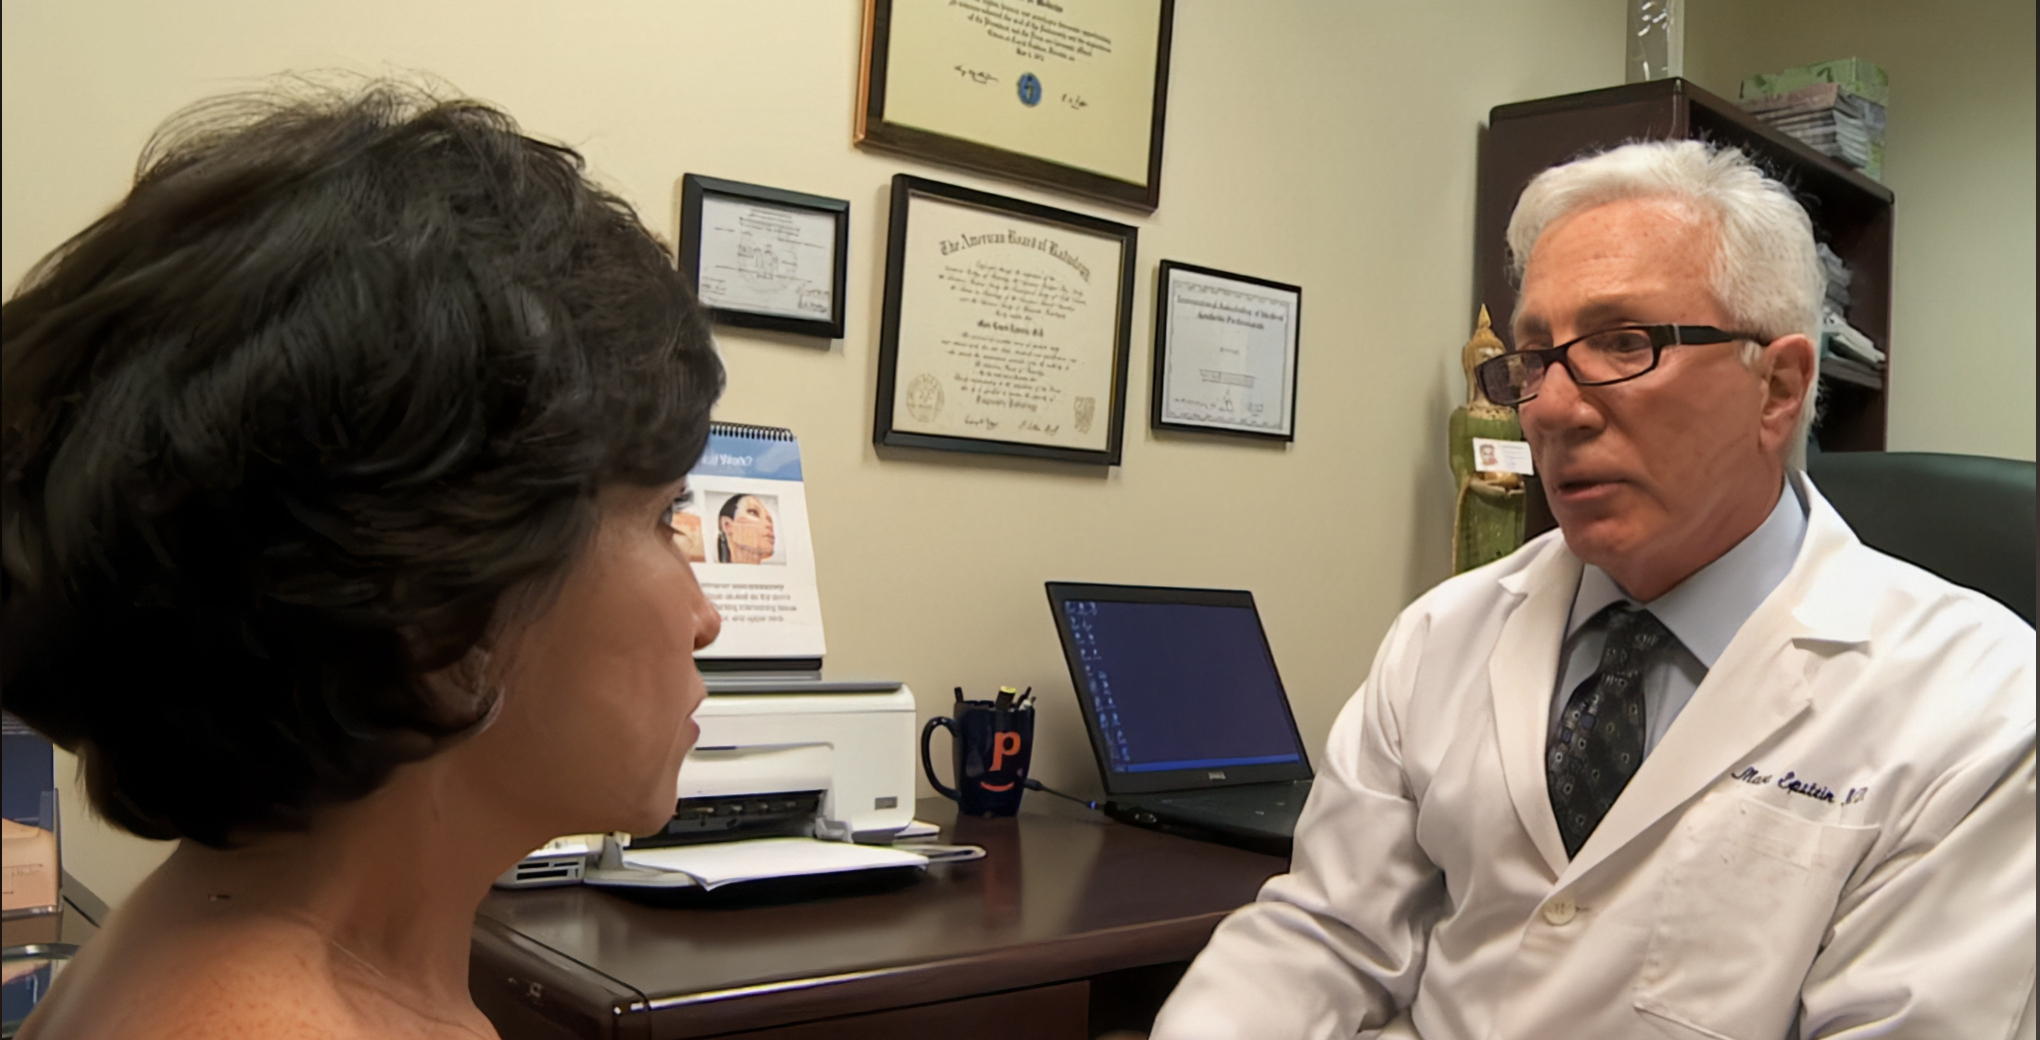
The Practice
Dr. Epstein's
Aesthetic Medicine.
Dr. Marc L. Epstein MD Aesthetic Medicine & Cosmetic Injections is a boutique, physician-led practice in Harrison, New York. The practice specializes in non-surgical facial rejuvenation — cosmetic injections, dermal fillers, and PDO thread lifts — designed to help you look like yourself, just more rested.
After 22 years as a Vascular Interventional Radiologist at the Miami Heart Institute, Dr. Epstein combined his medical precision with a background in the performing arts. That artistic sensibility shapes every treatment plan he creates for patients across Westchester County.
Though now based in Florida, Dr. Epstein continues to visit his Westchester practice on a monthly basis. His patients are so devoted to his care that they are always willing to wait for his visits.
30+
Years Medical Experience
MD
Physician-Performed
Why Patients Choose Dr. Epstein
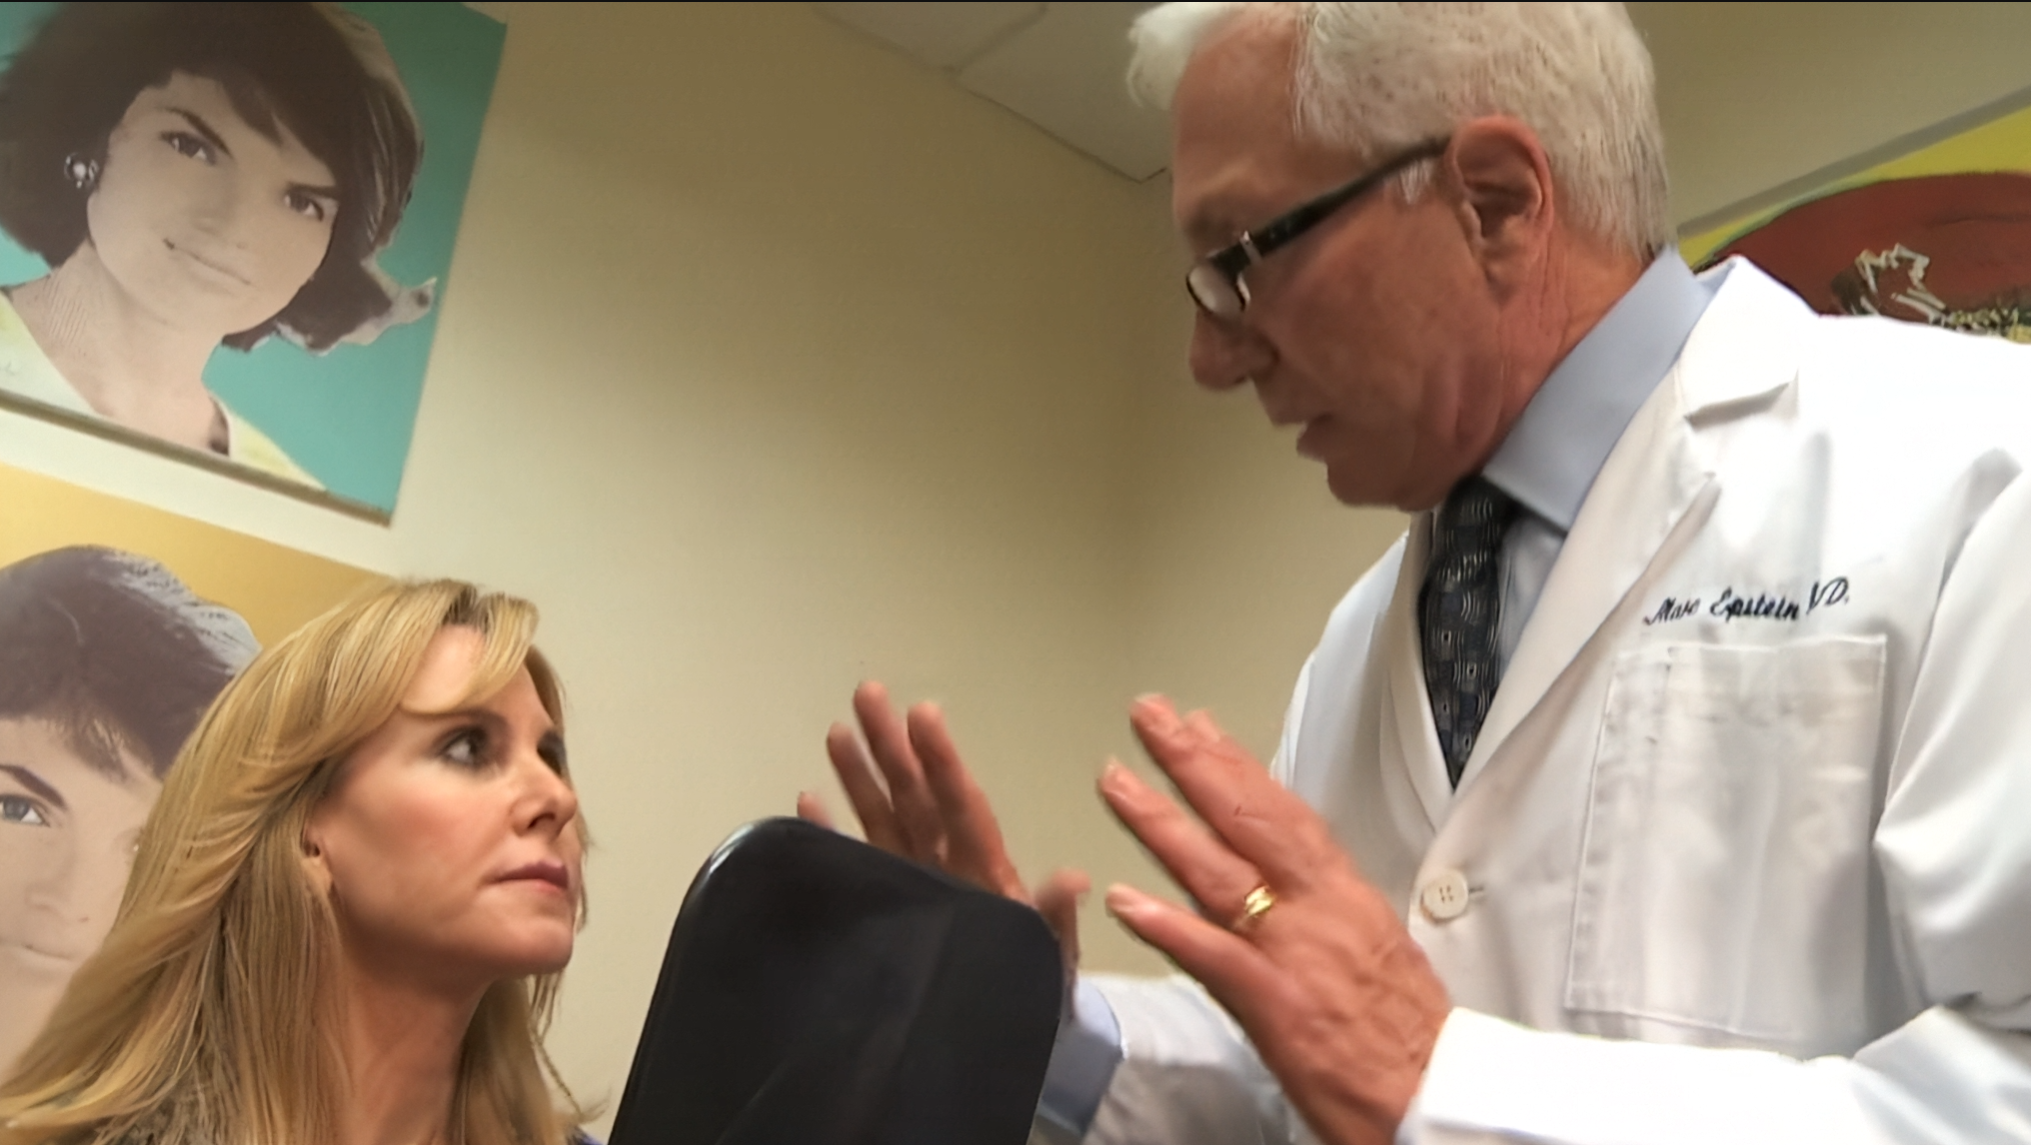
Physician-Performed Injections
Dr. Epstein personally administers every treatment. You see the doctor — not a nurse injector.
Over 30 Years of Medical Experience
Two decades of Vascular Interventional Radiology at the Miami Heart Institute trained Dr. Epstein's hands to work with precision inside blood vessels measured in millimeters. That same precision now guides every injection he places.
An Artist's Eye
Before aesthetic medicine, Dr. Epstein worked as a Broadway producer and actor. That creative background informs his approach to facial sculpting — he sees the face as a composition, balancing symmetry, proportion, and light.
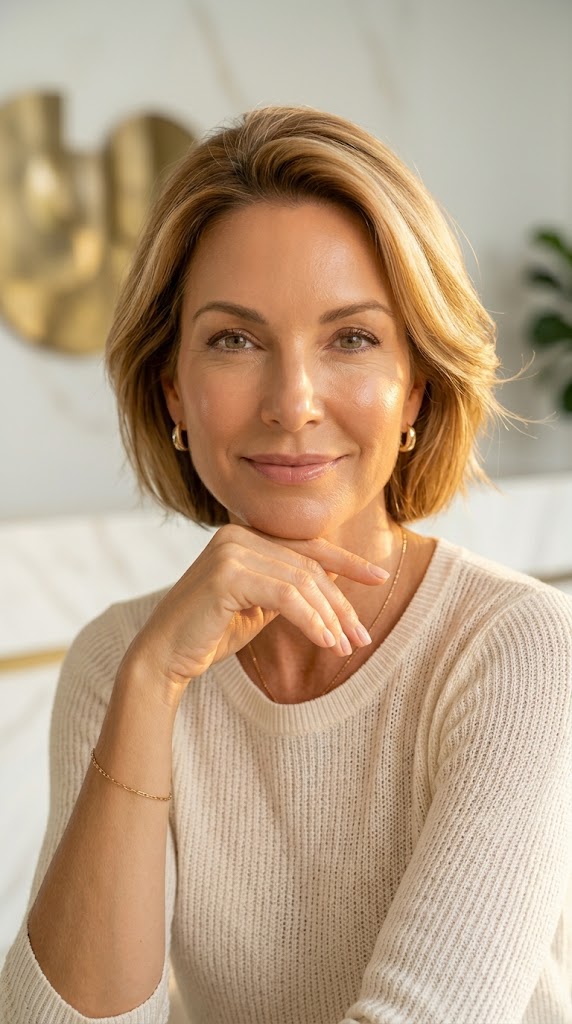
Natural-Looking Results
Patients return year after year because Dr. Epstein's work is subtle. You look refreshed, not frozen. Rested, not reconstructed.
The Portfolio
Signature
Treatments
Non-surgical facial rejuvenation protocols designed for natural, lasting results.
Facial Rejuvenation
Liquid Lift Facial Rejuvenation
The Liquid Lift is Dr. Epstein's signature combination technique. He uses volumizing fillers like Radiesse and Sculptra alongside Botox or Dysport to sculpt, smooth, and lift your entire face in a single visit. Patients leave with visible improvement — cheeks restored, jawline defined, fine lines softened — and results that improve over the following weeks.
Our Services
Our Treatments
Wrinkle Relaxers
Botox treatments · Dysport injections
Botox and Dysport relax the facial muscles that cause dynamic wrinkles. Forehead lines, crow's feet, and frown lines soften within days. Dr. Epstein selects the right neuromodulator for your facial anatomy, ensuring natural movement and a refreshed appearance.
Dermal Fillers
Juvederm · Restylane · Restylane Lyft · Radiesse · Sculptra Aesthetic
Hyaluronic acid fillers — Juvederm, Restylane, and Restylane Lyft — restore volume to lips, cheeks, and nasolabial folds with immediate results. Radiesse provides structural scaffolding that stimulates your own collagen. Sculptra Aesthetic works deep within the dermis to gradually replace lost collagen over several months.
Skin Rejuvenation
VI Peel treatments · PDO Thread Lift
VI Peel uses five proprietary acids to reverse sun damage, improve skin tone and texture, and stimulate collagen renewal. Safe for all skin types, it complements injectable treatments as part of a comprehensive anti-aging plan.
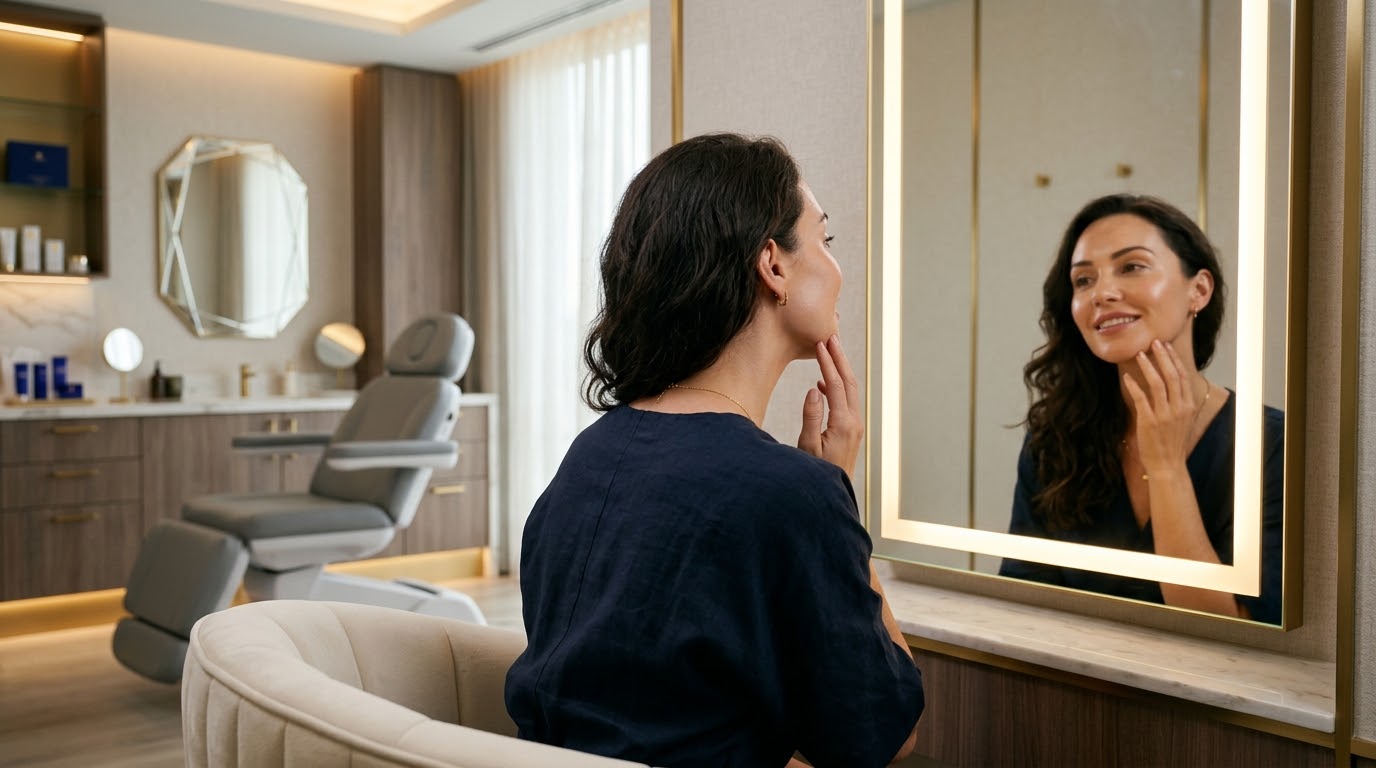
Inside the Practice
The Art of Personalized Care
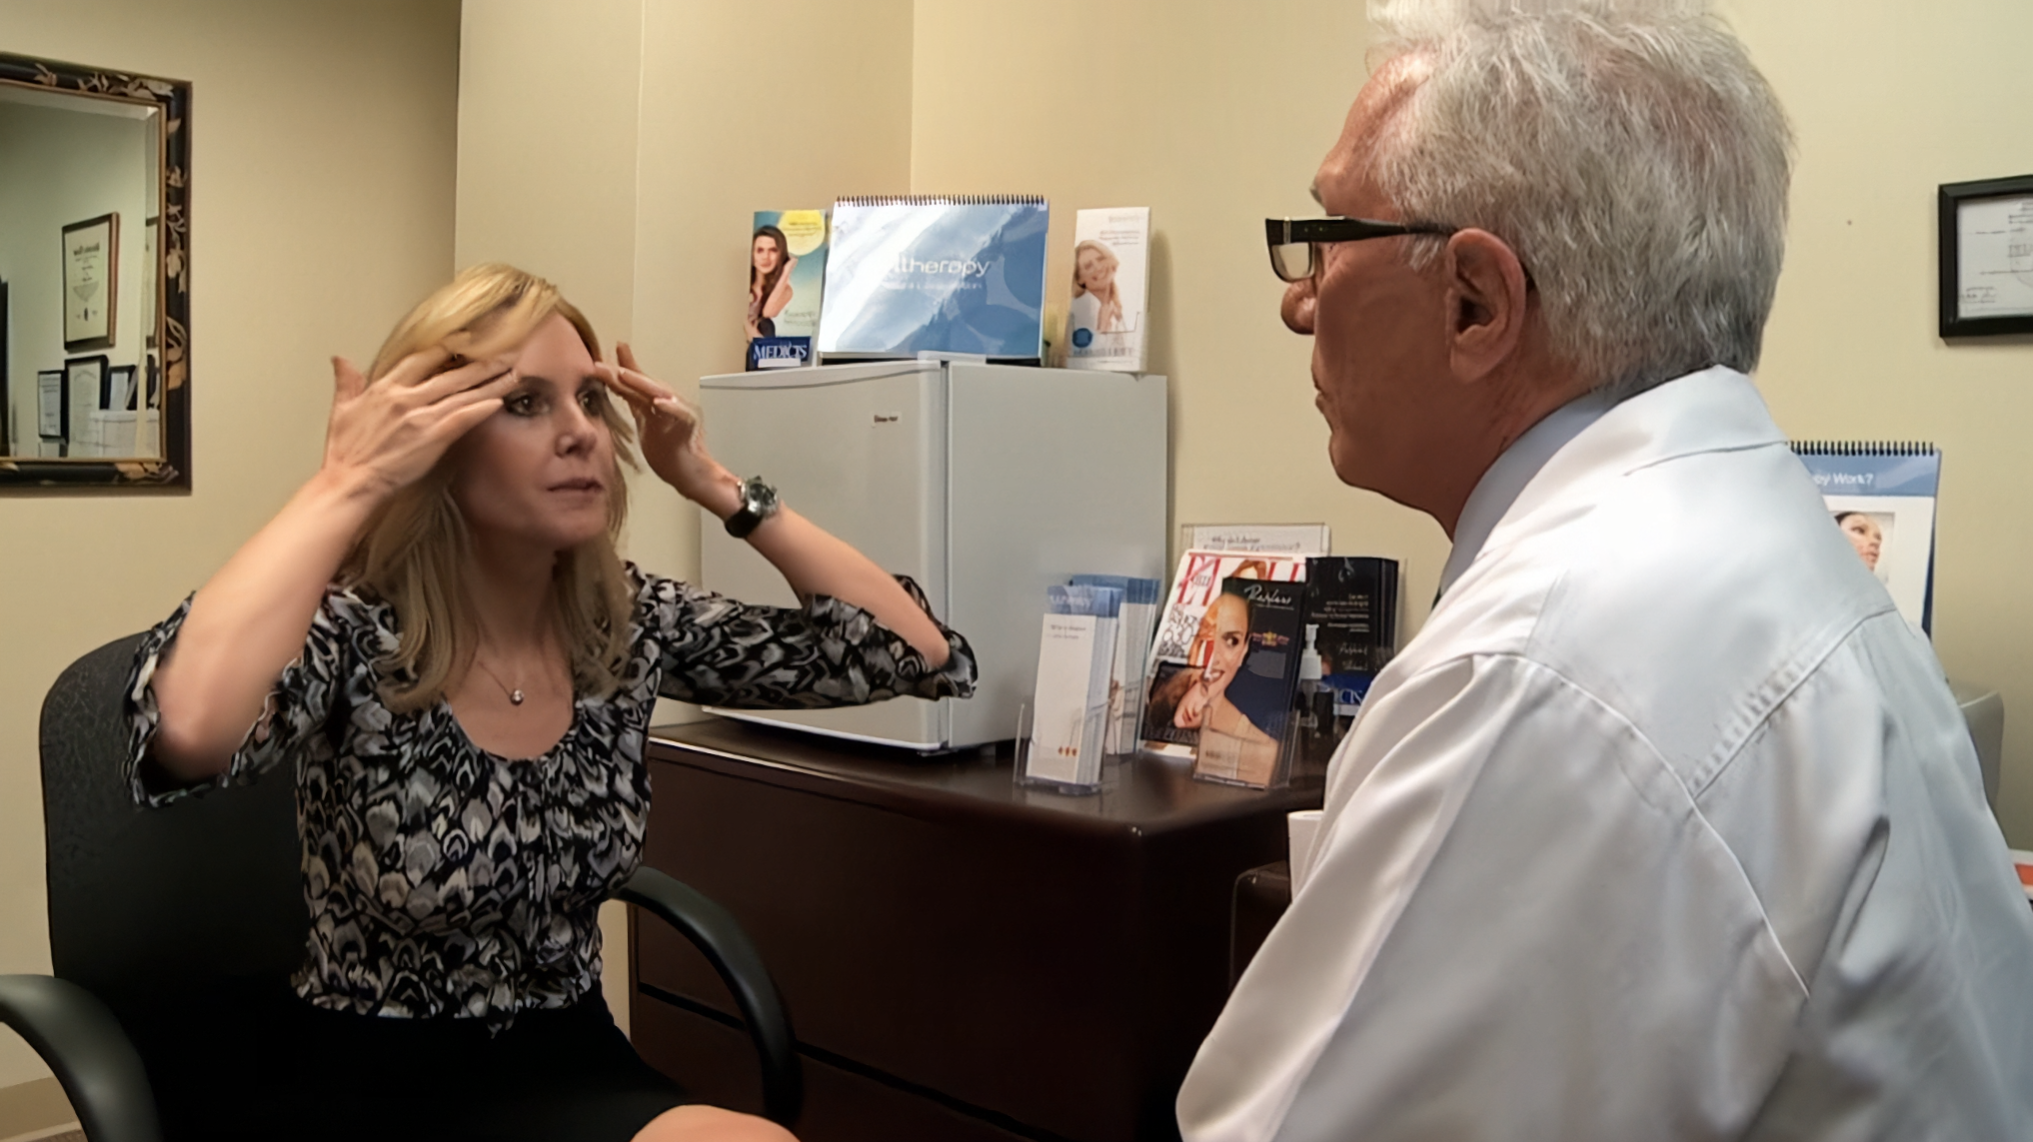
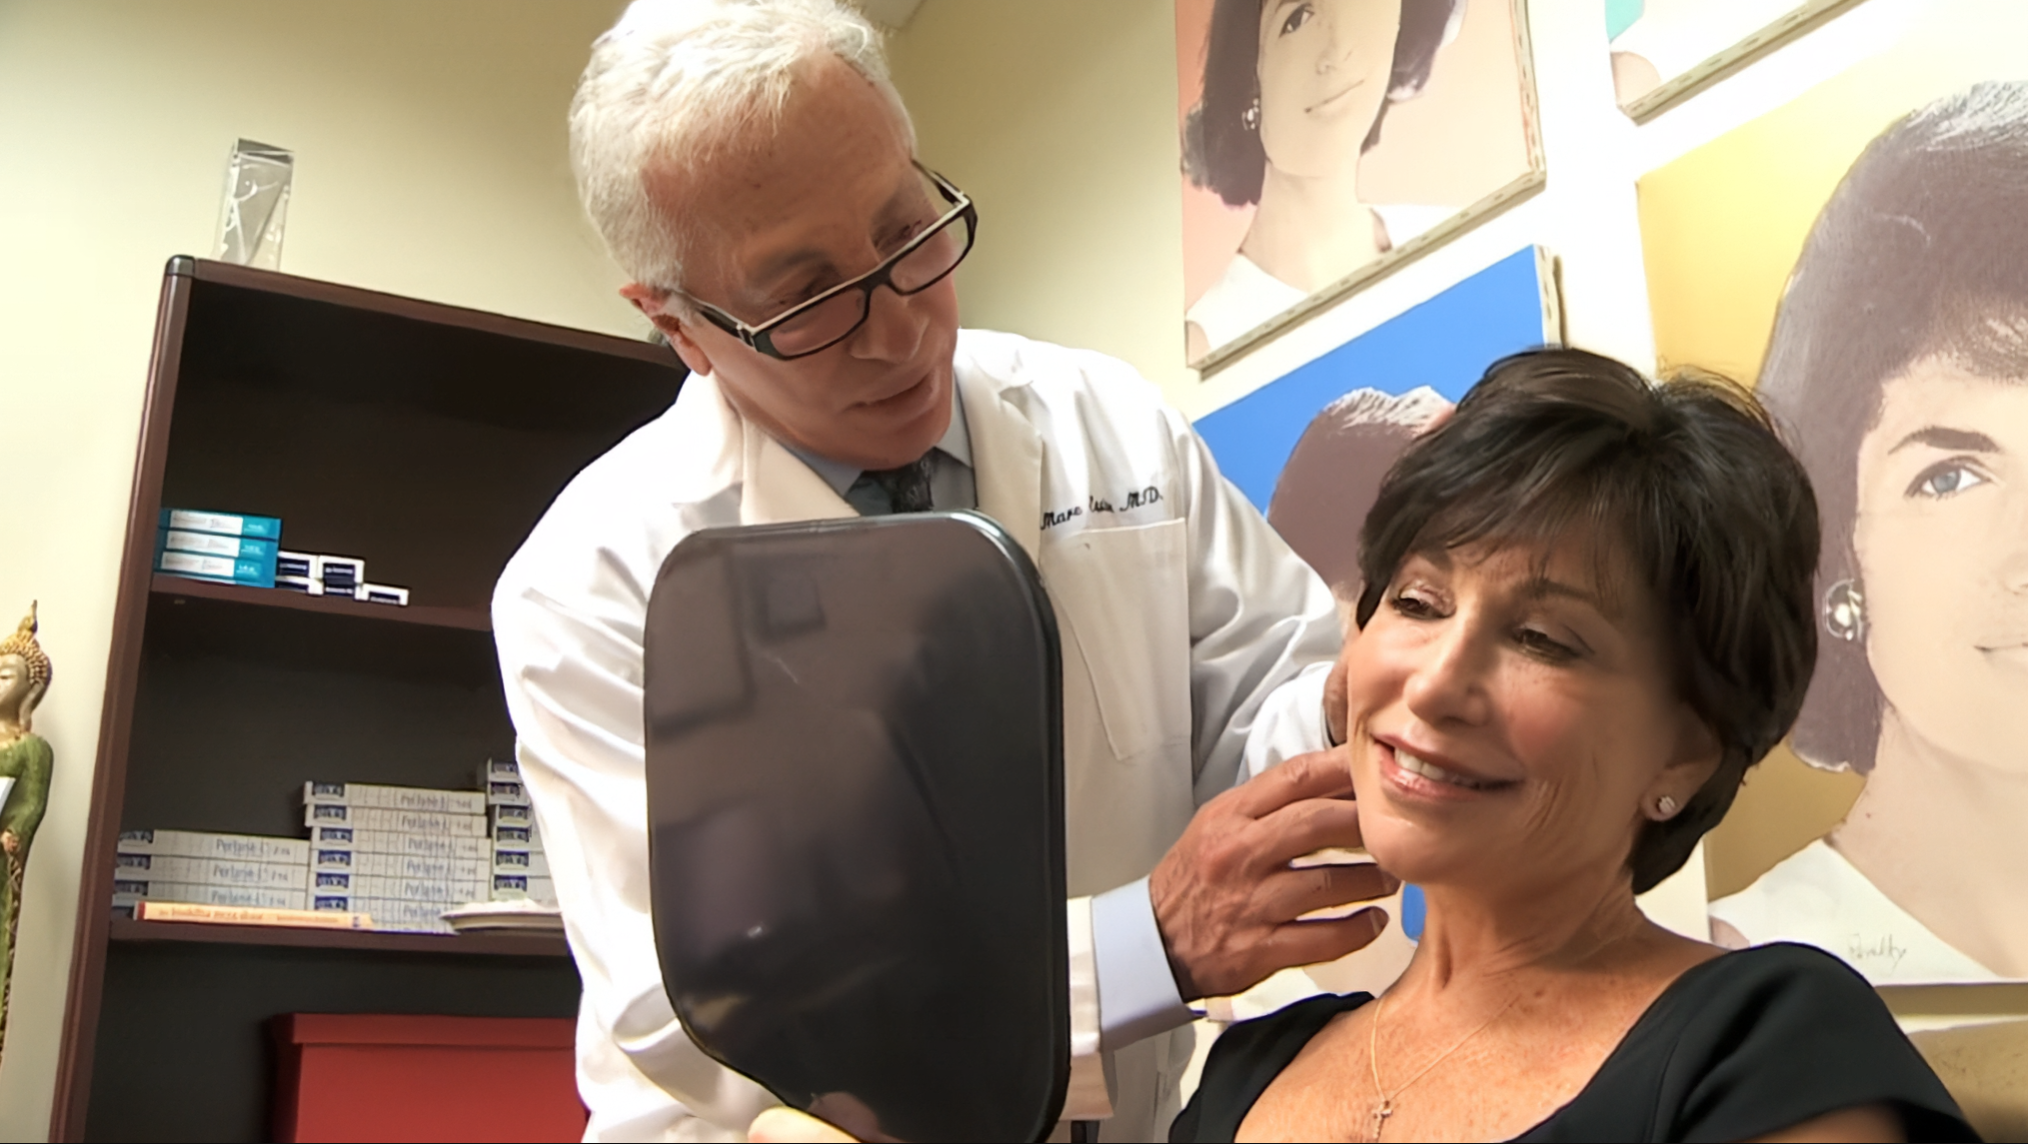
Every injection, every lift, and every peel is executed with the meticulous detail of a fine artist.
The Philosophy
Precision & Artistry
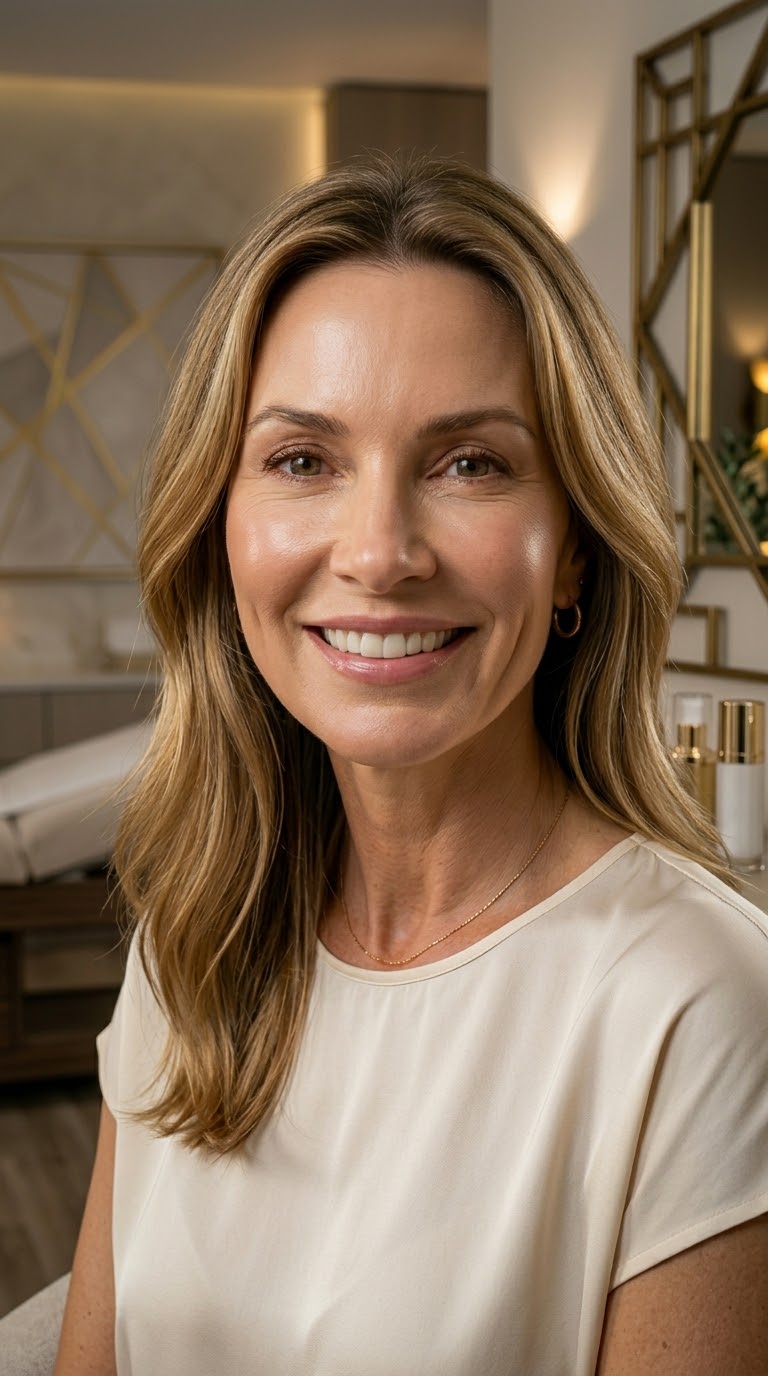
Patient Stories
What our
patients say.
Schedule your
consultation.
Ready to see what natural-looking rejuvenation can do for you? Call Dr. Epstein's Westchester County office to schedule a complimentary, no-pressure consultation. Every treatment plan is personalized to your features, your goals, and your timeline.
Location
Westchester County Office
600 Mamaroneck Ave
Suite 400
Harrison, NY 10528
Contact
P: 914-468-0828
Saxon Woods Corporate Center
Serving
Scarsdale, Rye, White Plains, Harrison, Larchmont, Mamaroneck, New Rochelle, Bronxville, Armonk, Greenwich CT
Dr. Marc L. Epstein MD Aesthetic Medicine & Cosmetic Injections serves patients from across Westchester County's most distinguished communities. Our office is located in Harrison, NY, at 600 Mamaroneck Ave, Suite 400, in the Saxon Woods Corporate Center.
Sound Shore corridor: Patients visit from Harrison, Rye, Mamaroneck, Larchmont, Rye Brook, Port Chester, New Rochelle, and Pelham for physician-performed cosmetic injections in a private, boutique setting.
Central Westchester: Residents of Scarsdale, White Plains, Eastchester, Tuckahoe, Bronxville, and Purchase choose Dr. Epstein for his artistic precision and natural-looking results.
Rivertowns and Northern Westchester: Patients from Dobbs Ferry, Irvington, Tarrytown, Armonk, Chappaqua, and Mount Kisco trust Dr. Epstein's 30 years of medical expertise for non-surgical facial rejuvenation. We also welcome patients from Greenwich, CT.